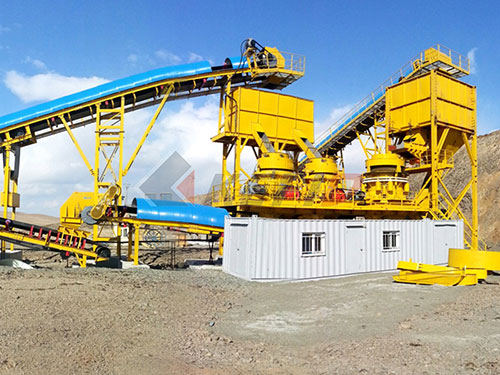
The Drop Weight Crusher: Measuring Rock Strength for Optimal Fragmentation
In the demanding worlds of mining, quarrying, and geotechnical engineering, understanding the fundamental strength and breakage characteristics of rock is paramount. Efficient blasting design, crusher selection, and overall comminution circuit performance hinge on accurately predicting how rock will fracture under impact loads. This is where the Drop Weight Crusher (DWC) emerges as a critical laboratory tool, providing invaluable data through a conceptually simple yet scientifically robust method.
Core Principle: Simulating Impact Breakage
The fundamental operation of a Drop Weight Crusher is elegantly straightforward:
1. The Sample: A representative rock specimen, typically sized between 50mm and 100mm cube or sphere, is prepared.
2. The Mechanism: A heavy weight (the “drop weight”), precisely guided along vertical rails or columns to ensure consistent impact alignment, is raised to a predetermined height above the sample.
3. The Impact: The weight is released freely under gravity.
4. The Breakage: The potential energy stored in the raised weight (`PE = mass gravity height`) converts into kinetic energy upon release and delivers a controlled impact blow onto the stationary rock sample upon collision.
5. The Analysis: The resulting fragments are carefully collected and sieved to determine their size distribution.
Deriving Parameters: T10 & Axb

The primary purpose of this test isn’t just to break the rock; it’s to quantify its resistance to impact breakage and generate parameters predictive of its behavior in larger-scale crushing processes.
T10 Value: This crucial metric represents the percentage of fragmented material passing a sieve size equivalent to one-tenth (1/10th) of the original feed size after a single impact at a specific energy level (`Ecs`, expressed in kWh/t). Essentially, T10 indicates how readily the rock produces fines under impact loading at that energy input.
Axb Parameters: By performing multiple tests on samples from the same rock type at different impact energy levels (`Ecs`) and plotting `T10` against `Ecs`, characteristic curves emerge. These curves are mathematically described by the Axb model: `T10 = A [1 – e^(-b Ecs)]`. Here:
`A` represents the maximum achievable T10 value for that specific rock type (asymptote).
`b` describes how rapidly T10 increases with increasing impact energy (rate
Leave a Reply